Nginx防CC攻击

什么是CC攻击

CC攻击(Challenge Collapsar)是DDOS(分布式拒绝服务)的一种,也是一种常见的网站攻击方法,攻击者通过代理服务器或者肉鸡向向受害主机不停地发大量数据包,造成对方服务器资源耗尽,一直到宕机崩溃。

limit_req_module

使用nginx提供给我们的limit_req_module模块来限制单个IP的请求次数

Nginx配置

1
2
3
4
5
6
7
8
9
10
11
12
13
http {
limit_req_zone $binary_remote_addr zone=one:10m rate=1r/s;
server {
# 限制每ip每秒不超过20个请求,漏桶数burst为5
# brust的意思就是,如果第1秒、2,3,4秒请求为19个,
# 第5秒的请求为25个是被允许的。
# 但是如果你第1秒就25个请求,第2秒超过20的请求返回503错误。
# nodelay,如果不设置该选项,严格使用平均速率限制请求数,
# 第1秒25个请求时,5个请求放到第2秒执行,
# 设置nodelay,25个请求将在第1秒执行。
limit_req zone=one burst=1 nodelay;
}
}

上面样本的配置是什么意思呢?

  • $binary_remote_addr 表示:客户端IP地址
  • zone 表示漏桶的名字
  • rate 表示nginx处理请求的速度有多快
  • burst 表示峰值
  • nodelay 表示是否延迟处理请求,还是直接503返回给客户端,如果超出rate设置的情况下。

详细的可以参考官方说明文档:Module ngx_http_limit_req_module

模拟请求

这里我们需要Apache Benchmark这个小工具来生成请求

1
2
//1个用户持续100s的时间向服务器发送请求
ab -t 100 -c 1 -vvv http://example.com/

Nginx配置样本一

1
2
3
4
5
6
http {
limit_req_zone $binary_remote_addr zone=one:10m rate=1r/s;
server {
limit_req zone=one burst=1 nodelay;
}
}

ab测试结果如下所示:

数据 成功的请求数 失败的请求数 请求时间 每秒成功的请求数
1 100 19438 101.195 0.98
2 100 17651 100.655 0.99
3 97 25735 100.424 0.96
4 101 26791 100.000 1.01
5 98 19051 100.514 0.98
平均 99 21733.2 100.557 0.98

以上失败的请求在Nginx上生成的错误日志如下显示

1
2
3
4
5
6
2015/05/09 12:48:57 [error] 6564#0: *2219 limiting requests, excess: 1.273 by zone "one", client: 10.0.2.2, server: example.com, request: "GET / HTTP/1.0", host: "example.com"
2015/05/09 12:48:57 [error] 6564#0: *2220 limiting requests, excess: 1.272 by zone "one", client: 10.0.2.2, server: example.com, request: "GET / HTTP/1.0", host: "example.com"
2015/05/09 12:48:57 [error] 6564#0: *2221 limiting requests, excess: 1.271 by zone "one", client: 10.0.2.2, server: example.com, request: "GET / HTTP/1.0", host: "example.com"
2015/05/09 12:48:57 [error] 6564#0: *2222 limiting requests, excess: 1.270 by zone "one", client: 10.0.2.2, server: example.com, request: "GET / HTTP/1.0", host: "example.com"
2015/05/09 12:48:57 [error] 6564#0: *2223 limiting requests, excess: 1.269 by zone "one", client: 10.0.2.2, server: example.com, request: "GET / HTTP/1.0", host: "example.com"
2015/05/09 12:48:57 [error] 6564#0: *2224 limiting requests, excess: 1.268 by zone "one", client: 10.0.2.2, server: example.com, request: "GET / HTTP/1.0", host: "example.com"

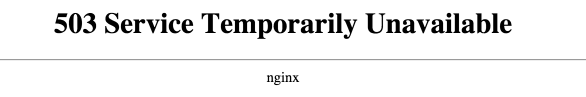
如上ab测试中如果是失败的请求,nginx的limit_req模块会统一返回503给客户端,浏览器上面显示的是这个样子的。

浏览器上显示503错误

Nginx配置样本二

在配置二里面,我把burst(峰值)提高到了10

1
2
3
4
5
6
http {
limit_req_zone $binary_remote_addr zone=one:10m rate=1r/s;
server {
limit_req zone=one burst=10 nodelay;
}
}

一些测试数据

1
2
3
4
5
6
7
8
|  数据  |  成功的请求数 | 失败的请求数  | 请求时间    | 每秒成功的请求数 |
|:-----:|:-----------:|:-----------:|:----------:|:-------------:|
| 1 | 110 | 19042 | 100.144 | 1.09 |
| 2 | 111 | 22271 | 101.714 | 1.09 |
| 3 | 111 | 18466 | 100.504 | 1.10 |
| 4 | 111 | 16468 | 101.285 | 1.09 |
| 5 | 111 | 12770 | 100.596 | 1.10 |
| 平均 | 110 | 17803 | 100.788 | 1.09 |

从数据来看,提高了burst值,明显nginx成功的请求数上去了。

Nginx配置样本三

在样本二的基础上,我们把nodelay去除掉

1
2
3
4
5
6
http {
limit_req_zone $binary_remote_addr zone=one:10m rate=1r/s;
server {
limit_req zone=one burst=10;
}
}

测试结果如下

1
2
3
4
5
6
7
8
|  数据  |  成功的请求数 | 失败的请求数  | 请求时间    | 每秒成功的请求数 |
|:-----:|:-----------:|:-----------:|:----------:|:-------------:|
| 1 | 96 | 0 | 100.223 | 1.09 |
| 2 | 98 | 0 | 100.238 | 0.97 |
| 3 | 100 | 0 | 100.761 | 0.99 |
| 4 | 96 | 0 | 100.074 | 0.95 |
| 5 | 97 | 0 | 100.021 | 0.96 |
| 平均 | 97.4 | 0 | 100.263 | 0.97 |

从这里的数据可以看到将nodelay的参数去掉的话,成功的请求数在100左右而失败的请求数变成0了,为什么呢?

  • 有nodelay参数的时候,nginx正常是及时处理当前的请求的并响应数据给客户端,但是如果超过limit_req_module的限制,那么会统一返回503给客户端。
  • 无nodelay参数的时候,nginx正常是及时处理当前的请求的并响应数据给客户端,但是如果超过limit_req_module的限制,那么会将此此请求缓存「就先这么理解」起来稍后再处理,所以也就不会出现大量的失败请求数了。

nginx lua

这部分的选择就是openresty了,推荐使用VeryNginx,原代码还算简单。目前我自己是在它的基础上自定义了一些功能,对付一些无脑爬虫也够用了。